 Cloud & Business Apps
 Cybersecurity
 Data & AI
 IoT & Connectivity
 Industry
 Health
 Banking and Finance
 Public Sector
 Retail
 Tourism and Leisure
 Transport & Logistics
 Energy & Utilities
 Smart Cities
AI of Things
Desde la unidad de negocio de AI of Things, Telefonica Tech ayuda a sus clientes en su proceso de transformación digital unificando las capacidades de IoT, Inteligencia Artificial, Big Data y Blockchain.
.jpg)
The potential of Artificial Intelligence of Things to transform a wide range of Industries
The concept of AI of Things (Artificial Intelligence of Things), encompassing digital technologies like IoT, connectivity, Big Data, and Artificial Intelligence, among others, is demonstrating its potential to transform various industries: agriculture, food, logistics, tourism, and industrial sectors. Physical objects equipped with IoT sensors and connectivity, combined with the analysis of vast amounts of data and the application of machine learning and Artificial Intelligence, enable valuable insights extraction. This capability includes recognizing patterns, automating tasks, optimizing processes, and making data-driven decisions. Such potential multiplies the value of connected things and unlocks new business opportunities. In this post, we've compiled a selection of content that explores some of the AI of Things technologies and applications developed, used, and implemented at Telefónica Tech. Connectivity & IoT IA & Data Automation, Connectivity and Augmented Intelligence at the service of a competitive, disruptive and sustainable reindustrialization May 18, 2023 Connectivity & IoT Satellites with 5G technology to provide IoT coverage worldwide April 10, 2023 AI of Things Smart football stadiums: the world's greatest show, made even better May 25, 2022 AI of Things Smart urban lighting: business opportunities and benefits January 25, 2023 AI of Things AI of Things (XIII): Data visualisation for optimal fleet management December 13, 2022 AI of Things New business opportunities using Internet of Things (IoT) November 29, 2022 AI of Things How digitalisation makes it possible to accurately identify and meet the needs of an organic cherry farm October 3, 2022 AI of Things What are physical shops and how are they transforming shopping? July 19, 2023 Connectivity & IoT IA & Data Industrial digitalization: we share the keys at Advanced Factories April 20, 2023 Connectivity & IoT IA & Data The ultimate evolution towards the digitisation of industry September 22, 2022 AI of Things 10-minute delivery: how Artificial Intelligence optimises delivery routes September 26, 2022 AI of Things LPWA and 5G networks enable new IoT solutions November 30, 2022 AI of Things AI of Things (XII): OEM solutions for the connected car November 15, 2022 AI & Data Edge AI: Artificial Intelligence outside Cloud April 13, 2023 AI of Things AI of Things (XI) Preventive maintenance on sensors: anticipating sensor failures, predicting battery replacement October 17, 2022 AI of Things Big Data and Artificial Intelligence solutions for the tourism industry September 27, 2022 IA & Data AI of Things for efficient and sustainable water management August 21, 2023 IA & Data Key ingredients for today's Smart Cities November 16, 2023 Connectivity & IoT 5G connectivity: Four real and practical use cases March 22, 2023 AI of Things How can we bring Internet of Things to the rural world? October 13, 2022 Image: rawpixel.com / Freepik.
July 26, 2023

Deep Learning: everything you need to know
Thanks to the enormous technological development of recent years, there are now solutions with a great impact on the business environment. A clear example of this is Deep Learning, a concept that is becoming more and more relevant in digital strategies thanks to the possibilities it offers. What is Deep Learning? It is basically a field of Artificial Intelligence (AI) in which algorithms mimic the way the human brain processes data. This happens thanks to artificial neural networks that seek to emulate the way the human brain operates, to identify patterns and generate predictions from large volumes of data. All without the need for supervision, so it is a type of Machine Learning, but much more advanced than traditional machine learning. Given the potential of this technology to extract valuable information - for example, to identify business opportunities or improve processes - several industries are investing in developments related to Deep Learning. It is estimated that this market will grow from USD 6.85 billion in 2020 to USD 179.96 billion in 2030, indicating its importance for business strategies. What role do artificial neural networks play? As we saw earlier, Deep Learning seeks to mimic the functioning of the human brain, using logical structures that resemble the nervous system, with a system of "artificial neurons" capable of perceiving different characteristics of the objects being analysed. To process the data, these neural networks are organised in layers that integrate multiple interconnected processing units, which work simultaneously, emulating the way the brain processes information. These layers are organised as follows: Input layer: represents the input fields for the data to be entered into the system. Hidden layers: can be several. They symbolise the bridge between the input and output of the neural network. Data will pass through all the processing units that make up these layers. Output layer: represents the final destination of the data and the place where the output of the model will be generated. Artificial neural networks continuously improve the performance of their predictions by comparing the responses with the expected results. These artificial neural networks represent algorithms capable of recognising patterns and distinguishing, for example, specific images or sounds in a matter of seconds. And although initially their predictive capacity will be very limited, after many repetitions the algorithm will be able to accurately replicate the known result based on the data used, acquiring greater autonomy and accuracy. Deep Learning Uses Now that we have clarified what Deep Learning is and how it works, let's take a look at some of its main uses today.: Speech recognition and automatic translation on platforms such as YouTube and Skype, or in digital assistants such as Siri and Alexa. Facial recognition in Google Photos. Anti-fraud methods that analyse the details of transactions (time of execution, recipients, amounts, among other relevant information) to detect suspicious actions that may affect bank accounts. In the agricultural sector, it can be seen in intelligent irrigation systems that take into account factors such as the level of water in the soil or humidity in the air. Deep Learning Benefits Given the applications it has, Deep Learning is positioned as one of the technologies with the greatest impact on the business environment, generating benefits such as: Process automation: the autonomous work capacity of deep learning allows different processes to be automated, achieving greater efficiency and quality. Ability to work with unstructured data: Deep learning is able to identify patterns and make predictions in a powerful way even when data is not organised. Long-term profitability: Deep learning can help organisations detect business opportunities or improvements in various areas. Scalable system: this technology works seamlessly with large volumes of data, so it can easily adapt to higher levels of information to keep pace with the growth of an organisation. Deep Learning is setting the pace in the digital transformation of organisations, impacting areas such as workflows, customer service and process optimisation. Making the leap towards this technology is crucial to boost competitiveness and, with it, strengthen the positioning of companies in an increasingly digitalised market.
September 6, 2022
Deep Learning and satellite images to estimate the impact of COVID19
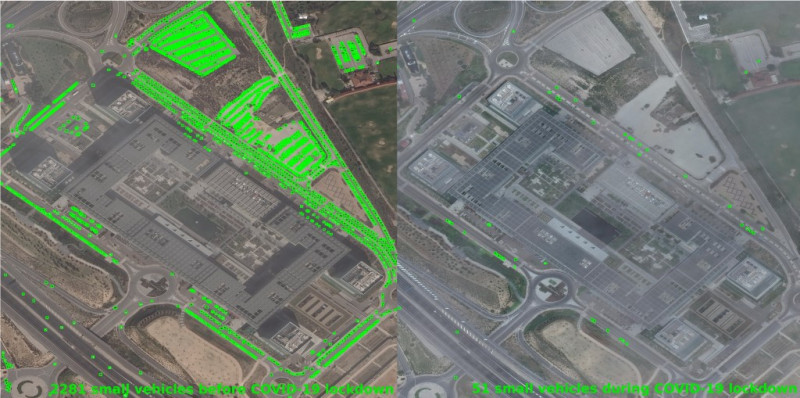
Motivated by the fact that the Coronavirus Disease (COVID-19) pandemic has caused worldwide turmoil in a short period of time since December 2019, we estimate the negative impact of COVID-19 lockdown in the capital of Spain, Madrid, using commercial satellite imagery courtesy of Maxar Technologies©. The authorities in Spain are adopting all necessary measures, including urban mobility restrictions, to contain the spread of the virus and mitigate its impact on the national economy. These restrictions leave signatures in satellite images that can be automatically detected and classified. Monitoring vehicles We focus on the development of a car-counting solution to monitor the presence of visible cars within high-resolution images. Recent studies reveal up to a 90% increase when comparing cars traffic between fall of 2018 and 2019 in several hospitals from Wuhan, China. This observation could mean that an infection was growing in the community and people required health care services. Similarly, we hypothesize that the number of vehicles decreased drastically during the COVID-19 lockdown in Madrid, thus we further investigate on how to accurately detect these vehicles using computer vision techniques. Figure 1: Satellite images courtesy of RSMetrics© suggest that COVID-19 may have been present and spreading through China before the outbreak was first reported to the world. Deep Learning For this reason, we research on how to accurately detect these vehicles using computer vision techniques. Recently, driven by the success of deep learning-based algorithms, most literature have pursued approaches based on Convolutional Neural Networks (CNNs). The main reason for this popularity is that CNNs can automatically learn feature representation so that there is no need for manual feature extraction. As a result, CNNs are attracting widespread interest because of their robustness to appearance changes under “in-the-wild” conditions. Current approaches detecting objects typically fail or lose precision due to the relatively small size of the target objects and the vast amount of data to be processed in the presence of multiple “in-the-wild” factors, such as, different cities/countries, viewpoint changes, occlusions, illuminations, blurriness, and so on. Figure2: Challenging appearance variability due to different factors including viewpoint changes (nadir angle), shadows, daylight changes marked by weather and seasons, etc. Labelled data We categorize existing approaches into two groups according to whether they estimate the number of cars directly from the image (counting by regression), or they learn to detect individual cars first, and then count occurrences to set an overall number of small vehicles in the image (counting by detection). We leap to the conclusion the latter approach achieves superior performance. Figure 3: Both supervised approaches need a set of training images with annotations. Counting by regression requires the overall number of cars as label. Counting by detection requires the vehicle position by setting the bounding box coordinates on each instance. Besides the aforementioned difficulties, the studies of object detection in satellite imagery are also challenged by the data set bias problem, which means that learned models are usually constrained to the same scene on which they were trained. To alleviate such biases, we train our model using also different vehicle annotations at different spatial resolutions from COWC and DOTA benchmarks, reflecting the demands of real-world applications. As far as we know, this is the first time that an algorithm successfully combines images at different resolutions to deal with the lack of satellite data properly annotated. Madrid dataset As we expected, we need the highest resolution commercially available in order to detect small vehicles. For this reason, we download 153 satellite images from 22 hot spots around the autonomous community of Madrid with a spatial resolution of 30 cm (WorldView-4 satellite data accessible using SecureWatch©). We select specific areas in Madrid where car-counting is a proxy of activity, such as shopping centres, highway crossings, hospitals, industrial areas and universities, among others. In the video below we visually observe the reduction in the total number of cars before and during the COVID-19 restrictions. Thus, it seems reasonable to study the overall impact of the lockdown on the traffic volume. https://www.youtube.com/watch?v=iJq0BnK9upQ Walkthrough over some processed images to visually perceive the dramatic reduction in the presence of vehicles over Madrid (audio in Spanish with English subtitles). Results In the experiments we measure the performance of our proposal, and compute car-counting statistics to quantify the dramatic drop in the number of vehicles during the lockdown. As a result, we corroborate these statistics using additional indicators such as telco data and traffic sensors data respectively. We reach the conclusion that these insights correlate with official statistics on economic activity, thus car-counting statistics can complement traditional measures of economic activity in helping policy makers tailor their responses to flatten the recession curve. Figure 4: Timeline curves of how the COVID-19 outbreak is evolving in Madrid since 2020. Red, yellow and blue colours compare curves obtained using anonymized and aggregated telco data from Telefónica Movistar antennas, traffic statistics acquired from the City Council of Madrid sensors, and by estimating the presence of visible cars with our satellite technology respectively. Additional information about the vehicle detection technology, the downloaded high-resolution satellite images, a market analysis, and comparative results for each region of interest are also submitted in the supplementary material. Written by Roberto Valle Fernández. Don't miss the next webinar (in Spanish) "Deep Learning and AI to improve traffic in times of Covid19″ that will take place on November 25th. To schedule this event click here. (Remember to follow the registration steps to watch it live) Spanish version: Other LUCA POCs here. LUCA visit our website, subscribe to LUCA Data Speaks or follow us on Twitter, LinkedIn or YouTube .
November 23, 2020

Are data-driven strategies in the energy sector competitive? Naturgy proves it.
In today's data story, we explore the success story of a large energy company, Naturgy, and how its digital transformation process towards becoming a data-driven company is already having a big impact, allowing them to position themselves as one of the leading companies in their sector. Within the Development Framework of the Center Of Excellence (CoE), inorder to meet the centralization needs of both analytical initiatives and organizational needs, as an essential first step, it was necessary to define the strategic transformation plan within this data-oriented organization. In order to tackle the challenge, with the help of the LUCA Consulting & Analytics, a global strategic assessment approach based on 4 axes was proposed. Technology: evaluation of the current Big Data platform to provide a reference architecture on which to implement use cases. Organization: defining an organizational structure capable of supporting the internal data governance program. People: evaluation of internal skills with the purpose of offering them a training plan using the Tshape methodology. Business: evaluation of the current level of analytical maturity and identification and prioritization of new use cases. This allowed the execution of 3 use cases due to successful identification and prioritisation during the assessment process, as well as an analytical data audit project, which concerned multi-country infrastructure. So what is the impact of this strategic approach on business and profits? Ramón Morote, Naturgy's CDO, confirms the use of Big Data tools in a company like Naturgy could have "a direct impact on the business" in several areas. The Project demonstrates the level of maturity of the company regarding its various data disciplines and how, thanks to LUCA's experience, it has been feasible to obtain a tactical and strategic solution in all 4 areas of the project. To stay up to date with LUCA, visit our Webpage, contact us and follow us on Twitter, LinkedIn o YouTube.
July 9, 2020

What is a connected car and how can it improve the driving experience?
Every day, we are surrounded by devices that are connected to the Internet. We only need to turn our eyes in any direction, and we can see televisions, coffee machines, mobile phones and tablets, everything is connected to the Internet. But what is a connected car? In the following post, we explain what it is and how it can improve the driving experience. What are the benefits of a connected car? A connected car is a vehicle that has an internet connection, with which it optimizes some of its functions. Like almost all networked devices, the purpose of its connection is to help the user. In our cars, it works in exactly the same way. The automotive companies have studied the subject and have created really important use cases for the drivers. Many of the benefits of these vehicles are associated with protecting the life of the driver. This represents a major advance in road safety. Imagine being able to protect the of your other passengers with a connected car. Well, this is now a reality and there exists approximately 380 million connected cars in the market today. Road death rates are really high all over the world. According to the WHO (2015), hundreds of thousands of children die every year as a result of car accidents. Faced with this sad reality, technology is constantly trying to improve vehicle safety. What is IoV? This connectivity, which is also known as IoV (Internet of Vehicles), forms a fusion with the surrounding environment. What do we mean by this? What we are trying to say is that the car is connected to all modes of urban mobility, other vehicles, pedestrians and the driver himself. Today, a smart city can have millions of connections, and generates millions of data points. A connected car can gain access to a lot of really useful information coming from the same city around it. Traffic lights, traffic, accidents, weather, road closures, etc. Everything can be transmitted to the driver to help inform decision making and prevent accidents. GPS is also another signal of the IoV. This type of connectivity is what many already use to get around town or to get assistance on the road. How does a connected car work? Today's vehicles have a lot of technology inside them. Part of this is what assists the vehicle to stay connected to its environment. This includes: Sensors They are in charge of collecting immediate information, concerning the car's environment. Driving patterns, nearby or imminent external situations, our position with respect to other vehicles, are just some of the data points which can be detected. Connectivity A specialty of Smart devices is their ability to connect to the Internet in different ways. In this case, cars are no exception. Whether it is via Bluetooth, WiFi, WLAN or 5G networks, cars have access to constant information. Decision making Now, with all this information our car can react in different ways. It can warn us that we have a vehicle in close proximity when parking, or when driving on the road. They can also inform us about the need for preventive maintenance of the vehicle or can warn the driver about risk situations, etc. What can I do if my car does not have all this connectivity? There are alternatives at present, which can turn our vehicle into a connected car. For example, Telefónica has a device that can connect it. This device is known as Movistar Car. Movistar Car, can become a WiFi point so that you do not ave to consume your cellular data, can offer assistance in case of accidents, GPS for the car, error alerts and much more. Without a doubt, it is another convenient feature for the operation of the IoV. In conclusión, there are many advantages that a Smart Car offers us, and it can even save our lives. Movistar Car is a good tool to make the car connected or improve the connection we already had. One way or another, a connected car is becoming safer and more necessary. What are you waiting for to join the IoV? To keep up to date with Telefónica’s Internet of Things area, visit our web site or follow us on Twitter, LinkedIn y YouTube. AI OF THINGS Say goodbye to traffic jams July 10, 2018 AI OF THINGS Autonomous Vehicles: when will they be a reality? January 31, 2020
June 26, 2020

Success Story: LUCA Transit and Highways England
The transport industry is very receptive to the application of Big Data and Artificial Intelligence strategies, as there are clear use cases that can maximize a companies' efficiency and improve infrastructure planning. Read in this post about the success story of Highways England to see how this company is making the most out of its data. Highways England is responsible for the daily operation, maintenance and improvement of the English motorways. In total, Highways England supervises more than 6900 km of roads which play a crucial role in the country's economic performance Thanks to advanced data analytics, Highways England has improved its efficiency and is able to generate higher quality data. Time spent collecting data has been reduced from 6 months to 7 days, resulting in a significant reduction in working hours and an annual saving of millions of pounds in data collection costs. Highways England Transport Optimisation Project In order to ensure the operability of it's roads, Highways England must collect a large amount of data. Previously, this process was arduous and costly in time and money. LUCA has worked closely with Highways England to obtain data more accurately, securely and affordably using mobile network insights. Thanks to our state-of-the-art LUCA Transit technology, Highways England now has access to our anonymised database, which contains over 4 billion network events generated every day by O2 customers. This data allows us to extract valuable insights for infrastructure modeling and planning. In the video below, Dave Sweeney, LUCA's Commercial Manager for Public Sector and Transport in the UK, explains how the use of Big Data and Artificial Intelligence helps Highways England and other organisations in the tourism and transport sectors: To learn more about LUCA success stories, visit our webpage, contact us and follow us on Twitter, LinkedIn o YouTube.
December 11, 2019

“Artificial is Natural”: The Artificial Intelligence event for companies
LUCA Innovation Day 2019 is arriving, the third edition of our annual innovation event where you will have to engage all 5 senses. Watch along on our live stream if you are unable to attend. It's a fact: Artificial Intelligence is becoming increasingly attainable and necessary, both in our personal environment and in the corporate world. On October 16th, we want to show you the applications of AI that we have discovered over the past year: a natural AI, accessible to any organisation, in any sector, for any business objective or need, which will help optimise your value proposal and strengthen the relationship with your clients. It's within your reach. LIVE STREAM: We want you to be able to experience all the event has to offer even if you are not able to attend in person. We have set up a live stream which means you can watch along with us from anywhere in the world. Click here to get access to the link! What do you have to look forward to? During this day, you will see most innovative uses and applications, developed in the last year at LUCA, which solve the needs of your business. You can hear first-hand the experiences of our clients and presentations from our experts, giving insight into upcoming trends and technologies that will transform your company. You will also have the opportunity to touch and experiment with our AI and multisector solutions live with our experts. Futhermore, you will also experience the launch of Movistar Living Apps, our new intelligent channel that transports your business directly into the home of Telefónica's millions of customers, via new initiatives, easily accessible by a single phrase thanks to Aura and the voice . Technology maximises the capabilities of our businesses, but we are the people who make the decisions. Will you join us? LUCA Innovation Day 2019 will take place on the 16th of October at 16:00 in the Central Auditorium of the Telefónica District (Madrid). We are waiting for you! Register here to come in person.
September 25, 2019

Artificial Intelligence in the Industrial Sector: the success story of Repsol
Although technological advances have been left behind in recent years, the industrial sector presents opportunities for developpment in the field of Big Data and Artificial Intelligence, and also in terms of efficiency and new sources of income. In this data story, we talk about Repsol, a global and integrated company in the energy sector. They have initiated a comprehensive digital transformation of the entire company as a lever for its strategic plan. In a company like Repsol, the impact of the widespread application of Big Data and Artificial Intelligence is very important. It also has a direct impact on the income statement. Juan José Casado, Data Analytics & AI Director de Repsol Repsol is committed to ensuring profitable growth to lead the energy digitial transformation process. In this regard, consultancy and analytical work which LUCA carries out is particularly relevant. In the context of digitalization, Big Data and Artificial Intelligence have permited the exploitation of thousands of data points collected over the years in their production processes. Achieved through analytical models developed by LUCA, it solved detected problems in each of the business areas. Thanks to the results and insights extracted from the different projects Repsol's decision making has been enriched. This makes its processes more agile and efficient, its planning tighter and its customer satisfaction higher. In this interview, Juan José Casado, Data Analytics & AI Director of Repsol, explains the magnitude and details of this work: This project is one of many successful efforts aimed at facilitating operational excellence, optimizing resources and raw materials, improving productivity in the plant and improving the quality of the final product. Finally, increasing customer satisfaction was possible thanks to an optimal knowledge of them. To stay up to date with LUCA, visit our Webpage, contact us and follow us on Twitter, LinkedIn o YouTube.
September 11, 2019

Improving intent to purchase with mobile advertising: Success Story of Milpa Real
The Kantar Millward study demonstrates the effectiveness of the Mobile Advertising platform Data Rewards. The objective of the Brand Lift study is to measure the effectiveness of an advertising campaign, identify whether it aids brand awareness, assess whether it is memorable and communicates the most relevant associations of the brand and finally determine whether the campaign shows an intent to purchase. Movistar Ads Mexico decided to conduct the Brand Lift Insight Study together with one of the best known toast brands in Mexico, Milpa Real of Grupo Bimbo. Using the the winning formula of LUCA Advertising Data Rewards in a video format, the aim was to gain a better understanding of Mexican Toast culture. The results produced by Kantar Millward Brown regarding the variable of brand awareness were really amazing: the surveyed group, who were exposed to the campaign through Data Rewards scored 5.5 per person above the control group that did not see the campaign, which means that the surveyed group had a greater awareness of the brand. Figure 1: Brand Awareness One of the indicators that most interested the brand was the association of the campaign/product message with Aztec culture. The result was excellent: the surveyed group scored almost 11 p.p. higher than the control group that did not see the toast campaign. Figure 2: Identification of message Kantar Millward Brown stated in the study that Milpa Real's ability to increase Brand Awareness through the campaign resulted in a higher intent to buy, which was reflected in the score of 4.8 p.p. higher than the control group. Figure 3: Intent to buy Finally, it is worth mentioning the effectiveness of the Data Rewards campaign compared to other major digital platforms that have a bigger presence in the advertising market. In this case, the results were again favourable for the Data Rewards campaign. In campaigns launched on one of these important platforms, the difference between the surveyed groups and control is much smaller (a difference of 2.8 p.p. in the message association variable) compared to the analysis conducted by Data Rewards (10.8 p.p. in the message association variable). Figure 4: The Brand Message has been understood and remebered by the chosen group. To conclude, after analysing all the data presented in the study, it can be stated that LUCA Data Rewards is the mobile advertising platform that ensures 100% of a chosen audience not only understand the brand message but remember it also. To stay up to date with LUCA, visit our Webpage, contact us and follow us on Twitter, LinkedIn and YouTube.
August 7, 2019

The acceleration of the insurance sector in Big Data
Of all the applications of Big Data, insurance companies demand to exploit the value of their data to enhance their relationship with their customer, from the acquisition to loyalty. In the insurance sector, there are few moments of interaction with the customer thereby few occasions to obtain information from them. Therefore, offering a personalized and agile service has become crucial. For this, data is fundamental as a raw material for the business intelligence, which far from being a complementary tool, as is seen in other sectors, is an asset to be exploited in a highly competitive and customer-focused sector. Today practically all companies in the sector are hiring experts to drive the digital transformation process, many of them lacking clear business objectives that mark their roadmap. The turnover of a company is not always linked to their Big Data maturity and few companies have managed to successfully exploit the value of their data. Insurance companies have a huge amount of data generated over the years and one of the main problems they face is precisely knowing how to manage their own information. This information is vital for the organization, since the profiling of the client is the essence of the insurance and the sector. Hence, analyzing both the profile of the client and their behaviour in the past, the interaction with the brand, with the products and the use of different policies, we can discover patterns that allow us to predict the client´s future behaviour. Thus, a greater knowledge of the client will serve as a basis for the development of initiatives based on the value provided by data which can result in the generation of new revenues, the improvement of operational efficiency or the fraud and risk detection. Big Data applied to the life cycle of the client in the insurance sector The data that insurance companies naturally possess is related to the different phases of the customer's life cycle, which is why there are clear work areas in which the exploitation of data plays a differential value: 1. Acquisition: a typical use case would be dynamic pricing, which allows calculating in real time and with the data facilitated by the potential client the risk index for the company. Based on this risk, the customer profile is determined (based on its potential value) and the appropriate premium is calculated. 2. Loyalty: through cross-selling and up-selling actions the life of the client can be extended to maximize the commercial relationship. Once the client's value is identified, the insurance company data can be crossed with external data. For example: data and statistics from the INE, the landing registry, meteorology, as well as traffic data and the type of car trip (in the case of automobile insurance). Currently, the treatment of external data is a plus, but in the future, does who not use it will be at disadvantage. 3. Risk Prediction: Big Data also allows predicting possible defaults and even the churn of customers to another insurance company before they make the decision. This is possible thanks to the collection of customer dissatisfaction information and the search for correlations that identify variables or events that alarm and predict the customers churn. 4. Fraud detection: Finally, Big Data helps in a key point of any organization, which has to do with the management of anomalies that can occur during an accident. The analysis of all sources of information allows to identify irregular patterns of customers behaviour as well as it helps optimizing the management of suppliers (cranes, fleets, etc.) adjusting the quality and cost of the service that the insurer receives from its suppliers when a client has an accident. Additionally, the analysis of the data can serve to detect irregularities in the commercial team of the company or in the agency network. Steps to become a data-driven insurance company The main barrier of insurance companies is usually the disorganization of the information they have. Normally, data is distributed in independent silos depending on the department they come from, without homogeneity or any connection between them. One of the main challenges is precisely to collect and share all the data at a corporate level so it becomes part of a unified repository that serves as a starting point for further analysis. Knowing the preparation and training available to people in the company, the work done in the identification of business initiatives, the characteristics of the existing databases, as well as the infrastructure and technologies available will determine the Big Data maturity and define future objectives. The Big Data strategy of a company must be led by business. It is not about technical issues or the implementation of technologies, as the strategy has to be associated with clear business objectives where data will respond to specific problems, being key to determine the direction of the company's strategy. Although we see a contact of the insurance sector with the digital transformation, this 2018 will undoubtedly be the year of Big Data takeoff in the insurance sector. By Alfredo Martinez You can also follow us on Twitter, YouTube and LinkedIn
July 31, 2019
CTGBCN: Solutions from the Catalan Capital
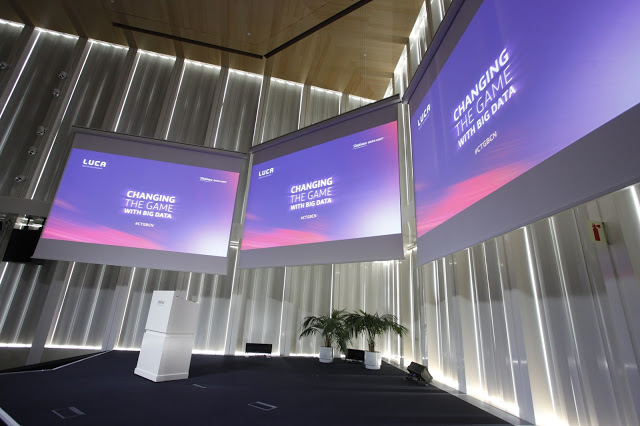
The Barcelona edition of Changing the Game with Big Data took place last Thursday at the Edificio Telefónica Diagonal. In case you weren't able to make the event or access the streaming this post will round up the highlights from last week. This will give you an idea of the in depth insights that were given with regards to optimization in tourism, retail and transport. Enrique Santiago started the proceedings and gave a brief introduction to both the audience and the viewers who were engaged with the live streaming. He highlighted the digitalization of the global market and the importance of reacting to this transformation in a reactionary, pro-active manner. Bruno Vilarasau Mitjans led the first talk and gave the audience an insight into various business models that are leading the digitalization in today's market having mentioned companies like JustEat, Uber and Whatsapp. He made it clear that the amount of data that is created through these applications can be transformed and anonymised in a secure way to lead to the creation of informative Big Data. Carlos Martínez Miguel gave an overview of his role within LUCA and gave an insight into how various problems have been addressed through the use of Big Data. He highlighted the variety of case studies and the broad nature of the use of LUCA. Mario Romero followed this introduction with a closer look at the benefits of LUCA Transit. This was then brought to life through the example of Zaragoza with Juan Ortiz Taboada and their collaboration with LUCA Transit. The morning of insights was finished by Alváro Alegría from Synergic Partners and Miguel Angel Díez Rincón with exciting partnerships that have developed in the retail sector. Figure 2: LUCA Transit was amongst one of the products discussed. The event in Barcelona gave the LUCA team another chance to share more success stories and good practice, follow this link to find out more from each speaker. Keep up to date with our social media platforms to find out more about upcoming events!
July 19, 2017

Our role in digitalizing Latin America with Big Data
This week, Telefónica and the International Development Bank (IDB) renewed their strategic alliance to continue promoting digital transformation and socio-economic development programs in Latin America from 2017 to 2020. This time, the Inter-American Investment Corporation (IIC) has also come on board, with the goal of strengthening collaboration with the private sector. This new addition, broadens the scope of the alliance as well as the opportunity to take joint actions on economic, social and digital development projects in countries where Telefónica, the IDB and the IIC operate, in collaboration with governments, civil servants and the private sector. The agreement was signed this week here in Madrid by José María Álvarez-Pallete, Chairman and CEO of Telefónica, and Luis Alberto Moreno, president of the IDB. This unique collaboration will focus on six different areas within the Smart Cities area as part of the IDB’s Emerging and Sustainable Cities Program. These include: Big Data projects focused on data analysis and public interest solutions. Digital Economy. Internet Accessibility and development of appropriate regulatory policies. Entrepreneurial support as framed within the Telefónica Open Future program. Development initiatives including the areas of education, health and security. During the first period of this strategic alliance (2012-2015), various development projects in diverse areas such as ICTs and microfinance, education, Smart Cities, internationalisation of SMEs and social entrepreneurship, in addition to collaboration on regulatory studies and publications. In LUCA, we are extremely excited about the opportunity to participate in Big Data projects in Latin America. We strong believe that using data for development is crucial in driving progress towards the 2030 Sustainable Development Goals, and for this reason we are regularly working with governments and NGOs to use our analytical capabilities for social good. In 2017, we will be taking part in a range of hackathons ( like this one in Rio de Janeiro) to see how mobile data and open data can be applied to the most pressing social issues out there.
January 20, 2017
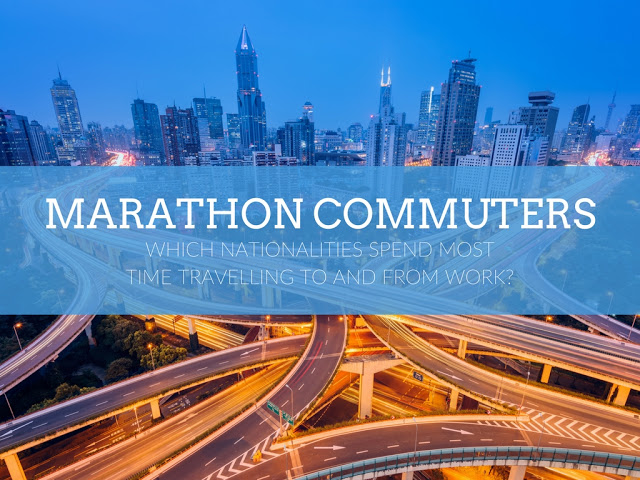
Marathon Commuters: Which nationalities spend most time travelling to and from work?
Just 600 cities are projected to create more than 60% of global economic growth by 2025. Our reluctance to distribute population outside of these urban powerhouses has caused city property prices to rise astronomically and our infrastructure hasn't always been able to grow fast enough to accommodate the growing number of commuters around the world. In the UK, the number of people spending more than two hours travelling to and from work every day has increased to 72% over the past decade to more than 3 million people, according to research by TUC. In fact, British commuters spend more than a tenth of their disposable income on annual rail tickets as the BBC mentioned in this 2016 report. This expensive and exhausting process has even caused some workers to consider commuting between countries (e.g. Barcelona to London) - a model which is clearly not aligned with the Sustainable Development Goals set by the UN. However, this culture of "marathon commuting" in the UK is not a consistent problem across the whole of Europe. Although the UK has the highest percentage of journey times over 2 hours (30%), countries like Madrid, Paris and Berlin are much lower at just 15% - suggesting that either their public transport infrastructure is better or people live closer to where they work, among other reasons. Figure 2: Average commute times in metropolitan areas with over 1 million residents. This is something that we decided to analyze, using our mobile data product, Smart Steps. Although comparably Barcelona doesn't have the worst commuting challenge (as you can see above), we worked alongside Barcelona City Council and Bestiario, looking at anonymized and aggregated Big Data to map commuting patterns in the city. By identifying home and work locations, we were able to understand the flow of workers and students around the 73 districts of Barcelona - providing insights on how long people spend commuting, their demographic profile and how far they live from their work. The study is explained in the video below: Video: Our Commuting Analysis of Barcelona. Barcelona has become a hub for innovation when it comes to taking a data-driven approach towards urban planning and mobility. With a population of 4.6 million in the wider urban area and a population density of over 16,000 people per square kilometre, as well as a thriving tourism industry - using cutting-edge Big Data and Internet of Things technology has become fundamental in optimizing the city to make it greener. A great example of this approach is the Barcelona Ciutat Digital plan, which prioritizes Smart City and Open Data projects to improve the quality of life for citizens. This innovation and transparency is crucial in ensuring that Barcelona continues to to drive an even more sustainable model when it comes to commuting, mobility and traffic. Here at LUCA, we are aware of the great challenges facing cities when it comes to sustainability. We also understand that the actions policy makers need to take go much further than monitoring and measurement. However, we strongly believe that becoming data-driven is the best place for the public sector to start. To find out more, visit our website or contact us here.
December 14, 2016
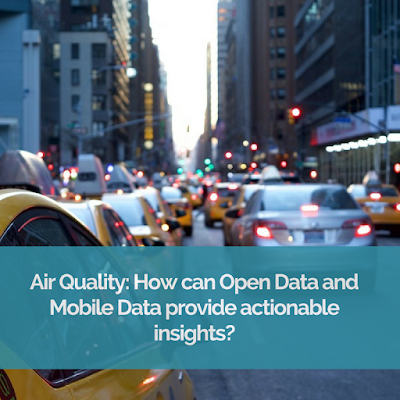
Air Quality: How can Open Data and Mobile Data provide actionable insights?
Today on our blog we've decided to take the mobility and traffic Big Data analysis we started here a little bit further, looking at the relationship between commuting and air pollution. Air quality is clearly a major challenge for large urban areas and according to the WHS , it is also a serious health risk, which is concerning given tha t in 92% of the world population in 2014 was living in places where the WHO air quality guidelines levels were not met . Reducing road traffic to improve air quality is proving a struggle for local governments, and to address this issue, they are monitoring a range of harmful gases on a day to day basis. One of these is Nitrogen Dioxide (NO2), and its production correlates directly to the density of motorised vehicle traffic as well as atmospheric conditions. To investigate this, we decided to visualize our Smart Steps data on mobility in Madrid alongside Open Data about NO2 measurements from the Madrid " Datos Abiertos" website. Here, we could find pollution measurement data from a range of air pollution sensors throughout the city, including the locations and the types of stations. You can also find local government policies on pollution protocol when NO2 levels are too high, citizen advice relating to air quality and information on their mobile application here. In our study, we focused on hourly NO2 readings registered in the 24 available stations from January to September 2016. To get the whole picture, it was important for us to find out (1) how often the stations exceeded alarm levels (200 micgr./m3), (2) the average levels (<40 micgr./m3 as normal average) and (3) the type of the stations (close to roads, residential areas, underground stations). Once the data was processed, it was relatively straightforward to build a dashboard to analyze the behaviour of each of the stations across the period as you can see below: Figure 2: Dashboard (TIBCO Spotfire) with the KPIs about the NO2 measurements in Madrid. The dashboard in div 2 reveals some clear insights: There is a significant increase of NO2 pollution in September, probably due to the lack of rain and wind (top right). Unsurprisingly, there are clear increases during rush hours (from 7:00 to 9:00 in the morning and 20:00 to 22:00 in the evening), although interestingly during the evening rush hour NO2 pollution levels are very similar regardless of whether it is a week day or the weekend (div 3). Figure 3: Hourly average NO2 levels per day of the week. As a next step, we overlaid average NO2 levels on top of the density of workers in each postcode. As you can see in div 3, there is a clear correlation between NO2 levels, the type of station and the density of traffic and both variables. Furthermore, there is a “green dot” in the middle of Madrid which represents the 350 acre Retiro Park. According to the data, this is unsuprisingly the best place to go you want some fresh city air, any time or any day of the week. Figure 4: Postcodes in central Madrid represented as coloured polygons according to the density of workers (red denoting a greater density). The markers represent air pollution sensors across the ctiy. In the above image, the markers denote air pollution monitoring stations. The red marker color shows that the station exceeded the average city pollution level for most of the months in the data-set. One should consider that 3 out of these 4 stations are close to a main street or motorway which results in higher measurements. When comparing against other cities around the world, the air quality in Madrid isn't actually that bad, as only 4 out of 24 stations exceeded the recommended threshold of 40 micgr./m3 (on average). , One should also highlight that there is one station in Madrid’s city centre (in the Plaza del Carmen) which registers high NO2 levels even though it is located close to a pedestrianized zone. However, when we take a closer look at Google Maps, we can see it is located between two car parks, which explains the above-average NO2 readings. The video we have prepared below shows how the usual home-work-home routes are closely related to pollution patterns. You will also see how areas with higher worker density have higher pollution levels, even though not all highly polluted areas have high worker density. Video: Walkthrough over the combined view of mobility and NO2 pollution levels (audio in Spanish). As we only analyzed pollution data for the centre of Madrid, we were curious to look at the rest of the Madrid region. We found a 2013 official report with a heat map of areas surpassing the maximum 200 mic./m3 threshold, then we made a visual comparison with the density map generated from Smart Steps mobility patterns (div 5 and div 6), showing considerable similarities as you can see below. Figure 5: Air quality (NO2) in Madrid Region. Geographic distribution of the number of hours with values greater than 200 micrograms/m3. Figure 6: Heat map generated from density of workers in the region of Madrid. Overall, it is important to mention one limitation when assessing the statistical significance of such "visual" correlation: the low number of available stations. Although a data-driven approach to pollution is extremely important for society, it also isn't affordable to place dozens of stations across the city to measure harmful gases such as NO2. One cheaper alternative would be to place mobile stations to monitor NO2 levels, which is one of the main objectives of the EU Japan collaboration project. The local government of Madrid is currently starting to deploy this mobile solution across the city's bus network as you can see in this article. We would love to play with the data collected from those mobile sensors in order to create a correlation model of traffic and pollution. However, in the mean time, we have Smart Steps data as a powerful complementary source to find out which areas of the city are affected by NO2 more importantly, making short term forecasts for policy makers to act accordingly. Needless to say, we would encourage all of our Madrid-based readers to use public transport, car sharing services and cleaner vehicles to ensure we start to reduce traffic and create a healthier city for the future, in line with the UN Sustainable Development Goals. By Javier Carro and Pedro de Alarcón, PhD. Data Scientists at LUCA.
December 12, 2016