At LUCA, we're passionate about the role that Big Data and technology can have in society, so last week on our blog we looked at
5 Medical Uses of Virtual Reality. As a company specializing in Big Data, a large part of what we do is creating
visualization tools which our clients can use to extract value out of their data. In this post, we look at how Virtual Reality can take these visualizations one step further.
Before we continue, it is worth understanding what we mean by a "Big Data Visualization". Big Data, by definition, involves working with millions of data points. In fact, one of the "
Four V's" that characterize Big Data is "
Volume". Recent years have seen an explosion of data in all areas of life, and businesses have realized the potential of these large quantities. However, simply having the data is not enough, the
value comes in analyzing it and extracting "Insights". The term "Visualization" simply refers to the way in which this information is presented in an understandable, and often interactive, way. We work with our partner,
Qlik, in order to provide high quality visualizations.
Now for the exciting part. As mentioned in the previous blog, Virtual Reality involves "
creating environments that can be interacted with in a seemingly real or physical way". These immersive environments have the potential to replace previous forms of Big Data visualizations such as timelines and infographics.
 Figure 1 : Infographics and pie charts can be replaced by VR visualizations.
 Using Virtual Reality to aid data visualization is not a new development. In fact, the University of Washington Human Interface Technologies has been working in the area for over 20 years. However, virtual visualization can now benefit from recent developments in the fields of
Artificial Intelligence, Machine Learning and Virtual Reality itself. Perhaps the company best known for merging Big Data and Virtual Reality is
Virtualitics, whose VR platform claims to be "the first collaborative data exploration platform that merges Artificial Intelligence, Big Data and Mixed Reality." In a demonstration that you can
watch on YouTube, one can see some of the amazing benefits that VR can bring to data visualization tools:
- With a virtual visualization, multiple members of you team can collaborate at the same time, with data that updates in real time. This has particular useful applications for global companies where teams are often connecting from the other side of the world. Traditional ways of displaying data can sometimes be hard to explain, but when viewing them in virtual reality you can explain certain ideas more easily.
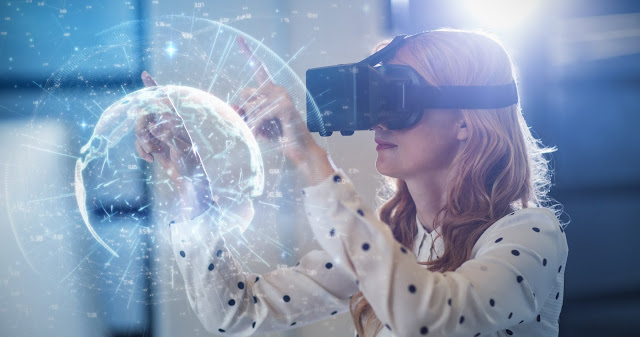
- VR can also bring a new level of immersiveness to data analysis. As humans, we can only process a limited amount of data at once, and as more data is added, our "processors" begin to struggle. In a VR data visualization, users can reach out and touch, manipulate and move the data in order to understand what it is showing you.
- The understanding of data is one of the area was VR really excels. As shown in the Virtualitics demo, data can be viewed in up to 10 dimensions, which means that user can see specific trends with greater ease. Additionally, machine learning can be used to analyze human interactions and expressions and thus change the graphics accordingly.
 Figure 2 : Virtual Reality can bring a new immersiveness to understanding data.
Of course, these benefits apply to the principle of VR Data Visualizations, and not just the solutions of Virtualitics. Other companies such as
DatavizVR are creating similar tools and it is likely that in the future more companies will enter the market. In the meantime, don't forget to follow us on
Twitter,
LinkedIn and
YouTube to keep up to date with all things LUCA.
 Figure 1 : Infographics and pie charts can be replaced by VR visualizations. Using Virtual Reality to aid data visualization is not a new development. In fact, the University of Washington Human Interface Technologies has been working in the area for over 20 years. However, virtual visualization can now benefit from recent developments in the fields of
Artificial Intelligence, Machine Learning and Virtual Reality itself. Perhaps the company best known for merging Big Data and Virtual Reality is
Virtualitics, whose VR platform claims to be "the first collaborative data exploration platform that merges Artificial Intelligence, Big Data and Mixed Reality." In a demonstration that you can
watch on YouTube, one can see some of the amazing benefits that VR can bring to data visualization tools:
 Figure 2 : Virtual Reality can bring a new immersiveness to understanding data.
 Hybrid Cloud
 Cyber Security & NaaS
 AI & Data
 IoT & Connectivity
 Business Applications
 Intelligent Workplace
 Consulting & Professional Services
 Small Medium Enterprise
 Health and Social Care
 Industry
 Retail
 Tourism and Leisure
 Transport & Logistics
 Energy & Utilities
 Banking and Finance
 Sports
 Smart Cities


